This a guest post by Yamil Hernández, first year PhD student on loan from Puebla, who is working with us in photosynthesis related projects for his thesis.
VMD (Visual Molecular Dynamics) is a free widely known visualizer developed by the Theoretical and Computational Biophysics Group from the University of Illinois. It is primarily used to analyze and visualize molecular dynamics (MD) results, as well as to prepare biological systems for further simulations. However, VMD is highly versatile; its functionalities extend far beyond MD, making it an excellent tool for analyzing molecular results from quantum mechanical calculations. In this blog post, we delve into some of these non-standard applications of VMD
1. Plotting Frontier Molecular Orbitals (FMO) and Electrostatic Potential (ESP)
VMD is able to plot .cube files, which can be generated by quantum chemistry software or analysis tools like GaussView, Chemcraft, or Multiwfn.
In the following example, we use a glucose molecule optimized at the B3LYP-D3/6-311+G** level of theory using the SMD implicit solvent model to simulate an acqueous environment in ORCA 6.1. FMO and ESP .cube files were generated using Multiwfn.
1.1 Frontier Molecular Orbitals (FMO)
Load each orbital .cube file as a New Molecule (separated molecule ID’s). This will display the molecule framework. You can customize the molecular representation as described below. Change the Coloring Method to Element so the atoms are distinct. (In this example we changed the carbon color to silver in Color Controls window.)
Open the Graphical Representation window. Let’s walk through plotting the HOMO (the process for the LUMO or any other orbital is identical).
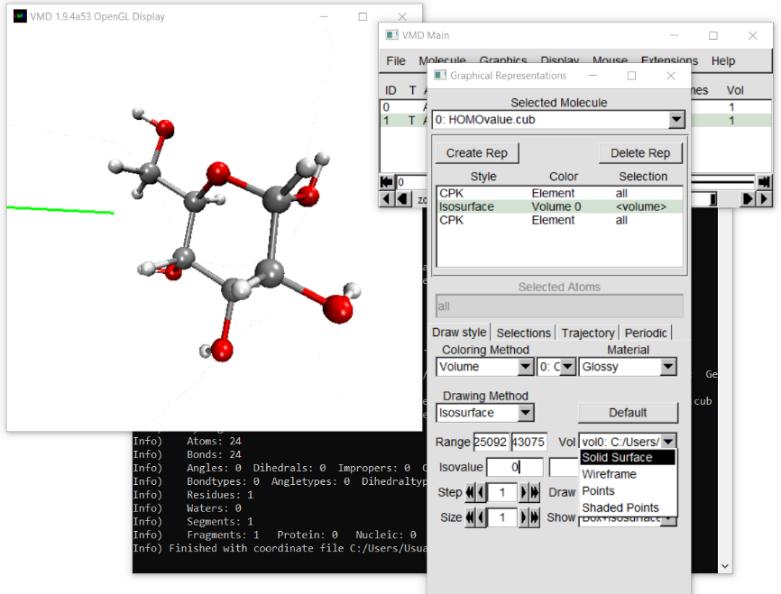
With the orbital molecule selected in Graphical Representation, click Create Rep twice to generate two identical duplicate layers.
Select the first new representation layer:
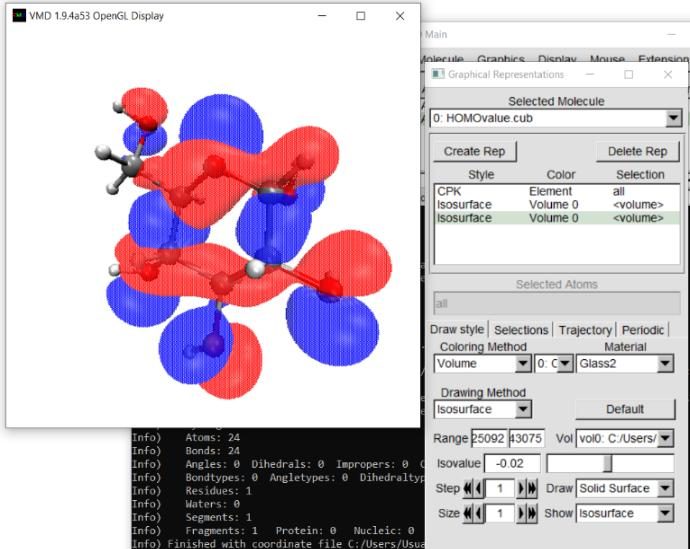
- Change the Coloring Method to Volume and the Drawing Method to Isosurface.
- Change the Draw dropdown from Points to Solid Surface.
- Set the isovalue to 0.02 (the standard threshold for molecular orbitals). Part of the orbital surface will appear in white.
- Switch to Trajectory tab in the same window and adjust the Color Scale Data Range from -0.1 to 0.1 to apply the phase color.
Select the second duplicate representation layer to map the complementary lobe:
- Repeat the exact same steps, but set the isovalue to -0.02.
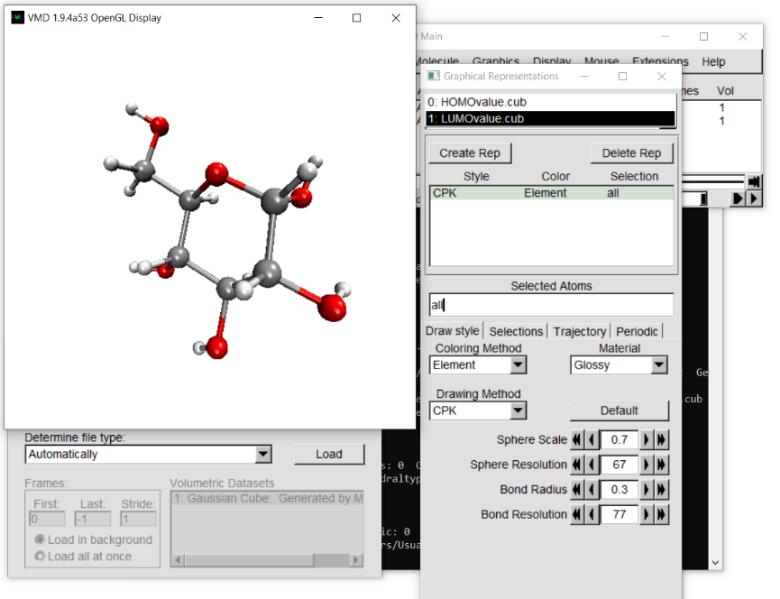
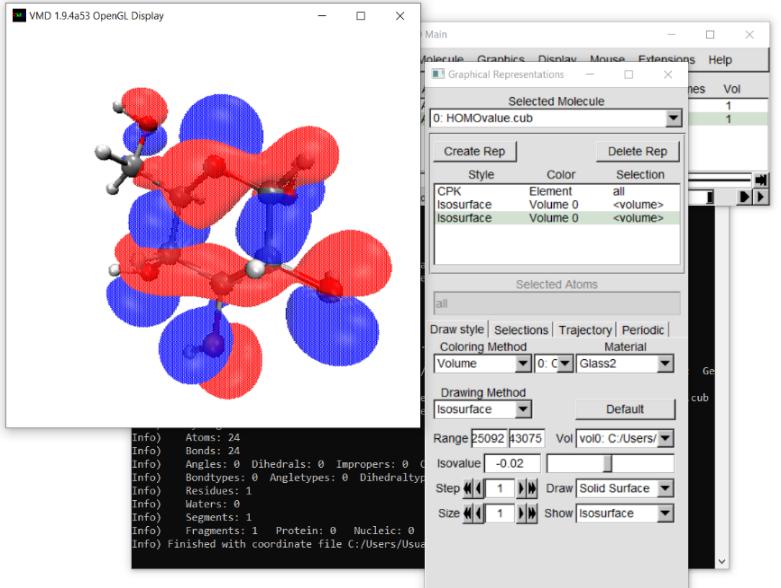
1.2 Electrostatic Potential (ESP) and other mapped surfaces
This procedure applies to most property-mapped volumetric surfaces saved as .cube files. Mapping ESP requires two files: the electron density .cuve and the ESP .cube files.
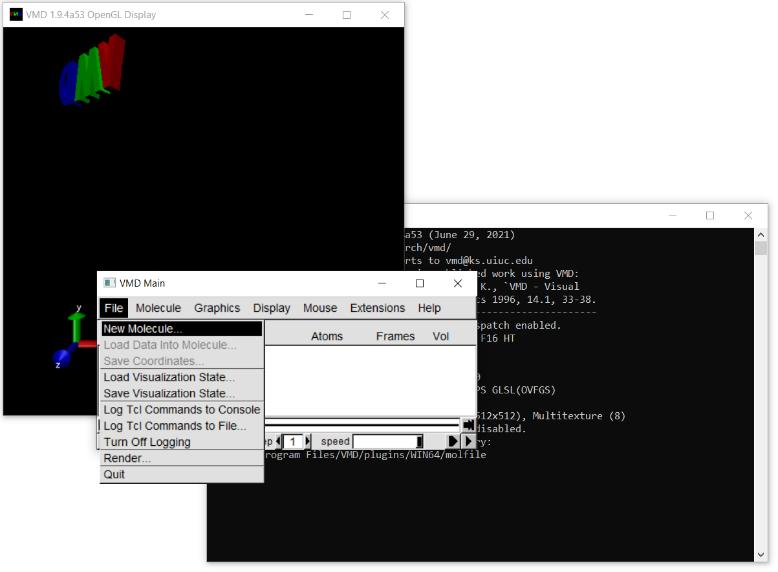
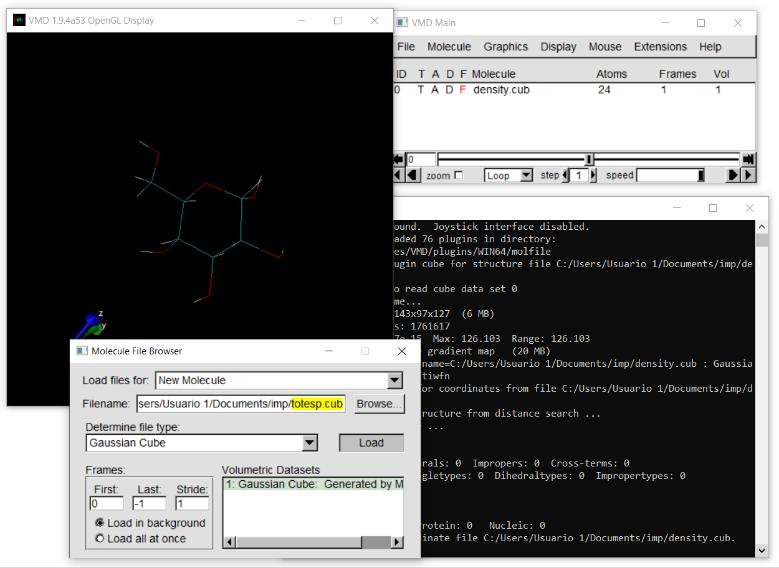
Go to File -> New Molecule and load the electronic density .cube file first.
Next, select that same molecule ID in the Load files for: dropdown menu and load the ESP .cube file into it. The molecule ID should now contain two volumetric datasets (Vol 0 and Vol 1).
Open Graphical Representations and customize your underlying molecular structure.
Click Create Rep to make a new layer for the surface:
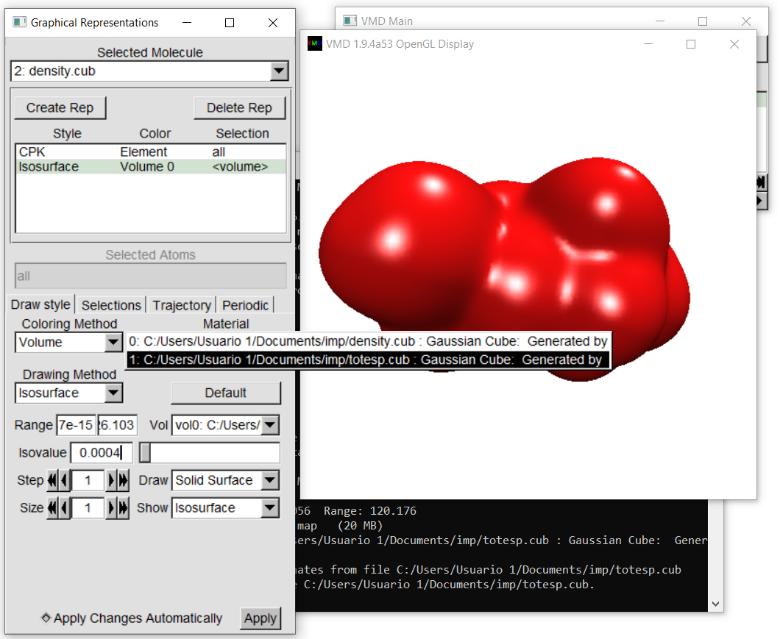
- Set Coloring Method to Volume and Drawing Method to Isosurface.
- Set Draw option to Solid Surface.
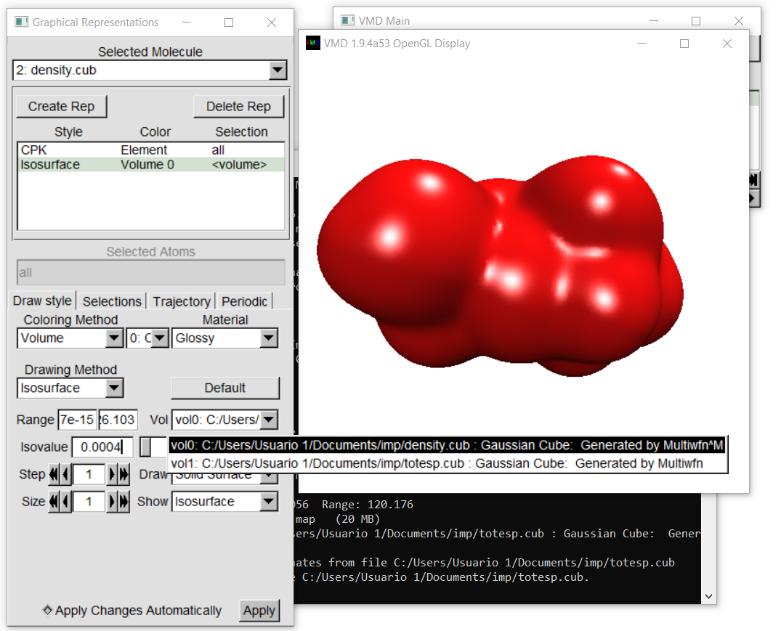
- Ensure the Vol dropdown is set to vol0 corresponding to the electron density .cube file.
- Set the isovalue to 0.0004 (atomic units), which is standard for defining the molecular surface.
To map the ESP gradient to this density surface:
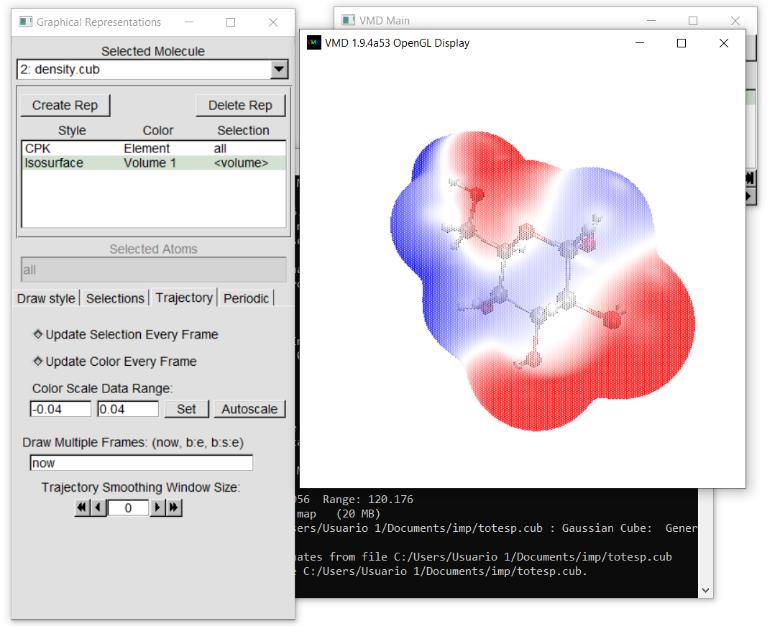
- Look at the small dropdown menu located between Coloring Method and Material (It defaults to vol0). Change this to vol1 (the ESP dataset).
- Go to Trajectory tab and set the Color Scale Data Range from negative to positive values.
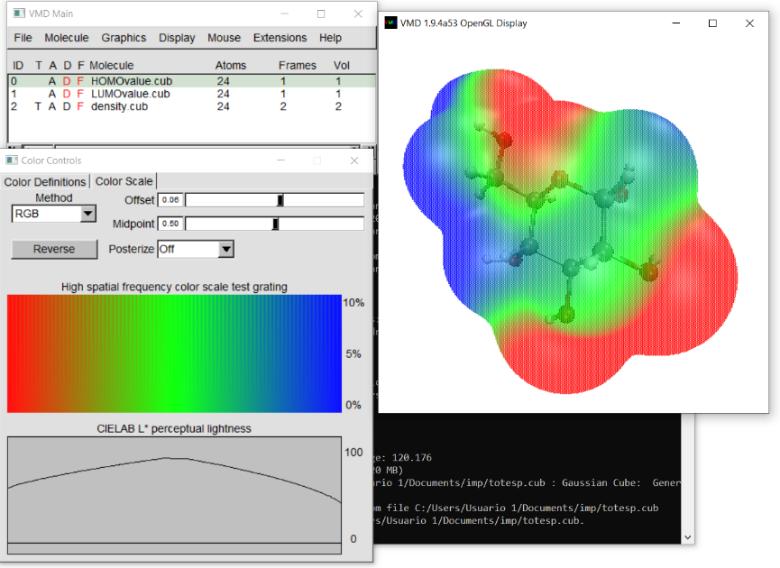
By default, VMD applies a Red-White-Blue (RWB) color scale. If you prefer the RGB gradient, open the Color Controls window, navigate to the Color Scale tab, and change the Method to RGB.
2 Comparison of Molecular Geometries
VMD allows you to compare two or more geometries of the same molecule using two different approaches. Crucially, all geometries must share the same atom numbering. To illustrate this process we’ll use different geometries of Chlorophyll-a.
One common way to compare molecules is by overlapping them.
First, load the different molecular files into separate molecule IDs:
- Go to file menu and click on New Molecule.
- In Molecular File Browser, select the file for your first structure and load it.
- For the second structure, ensure that Load files for: is set to New Molecule to avoid overwriting the first one, then select and load the file.
Once all structures are loaded, they will appear piled up on top of each other in the OpenGL window.
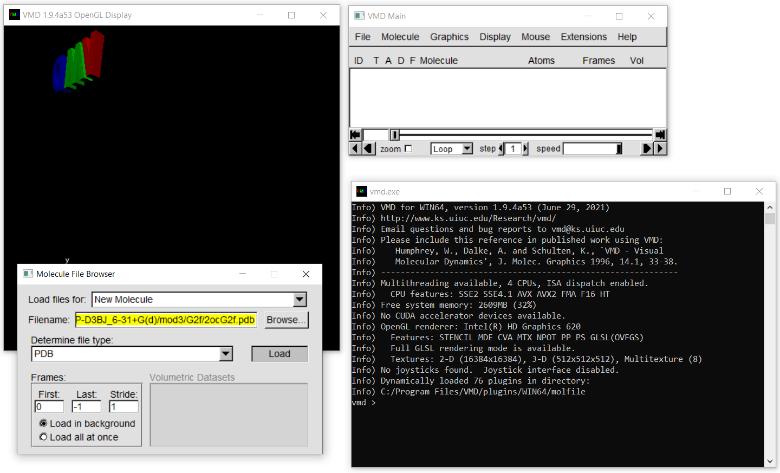
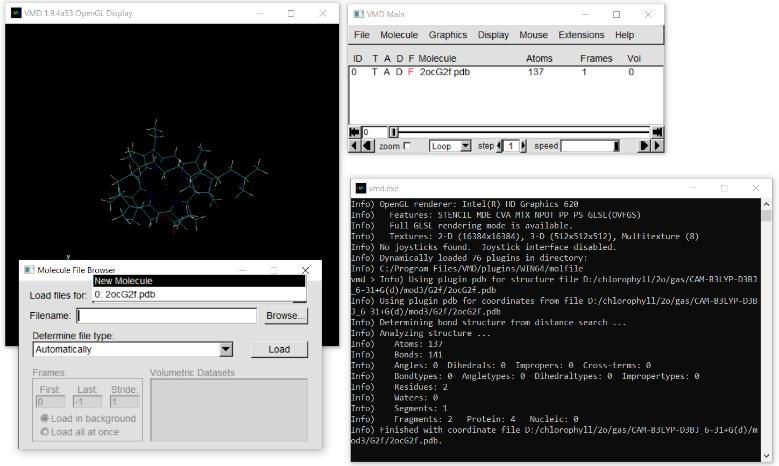
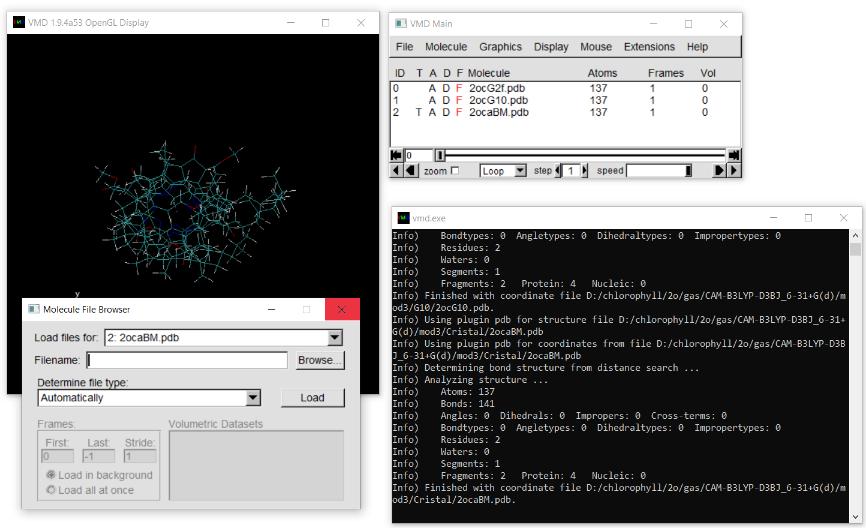
Before overlaping the structures, let’s customize the visualization. For better clarity, a white background with distinct color for each molecule is recommended
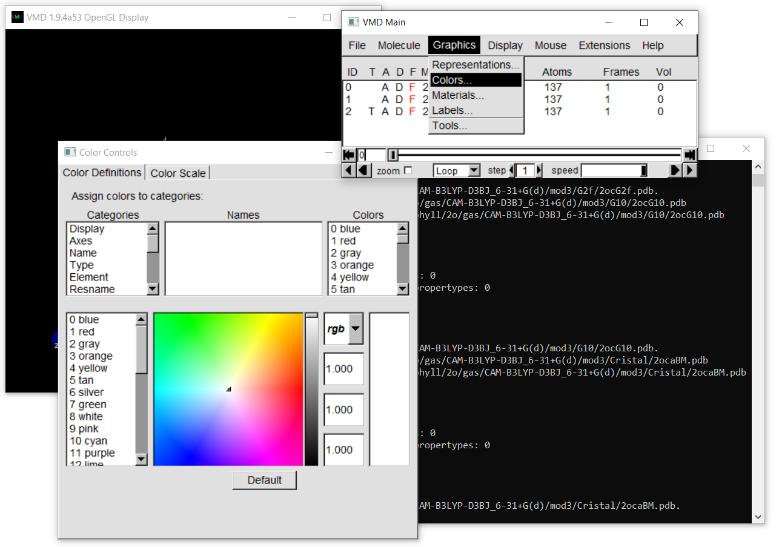
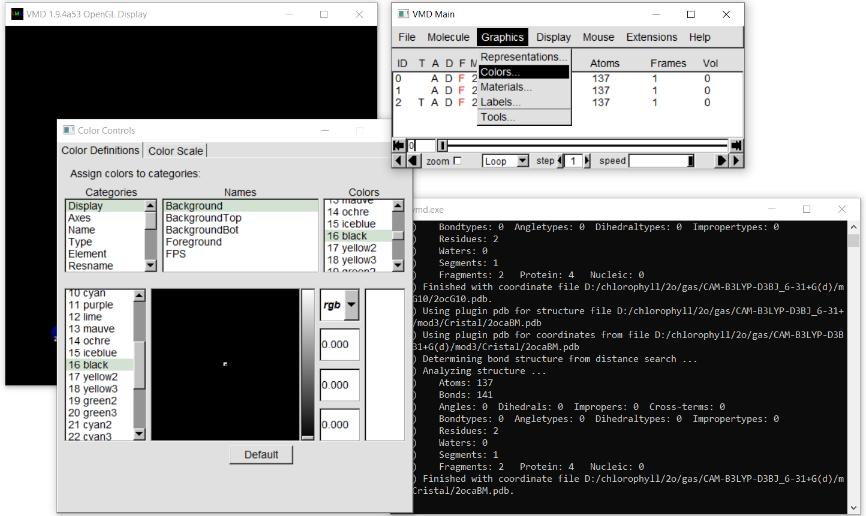
Close Molecular File Browser and open the Color Controls window by clicking on Graphics → Colors….
To change the background, select Display from the Categories list, choose Background from the Names list, and select your preferred color.
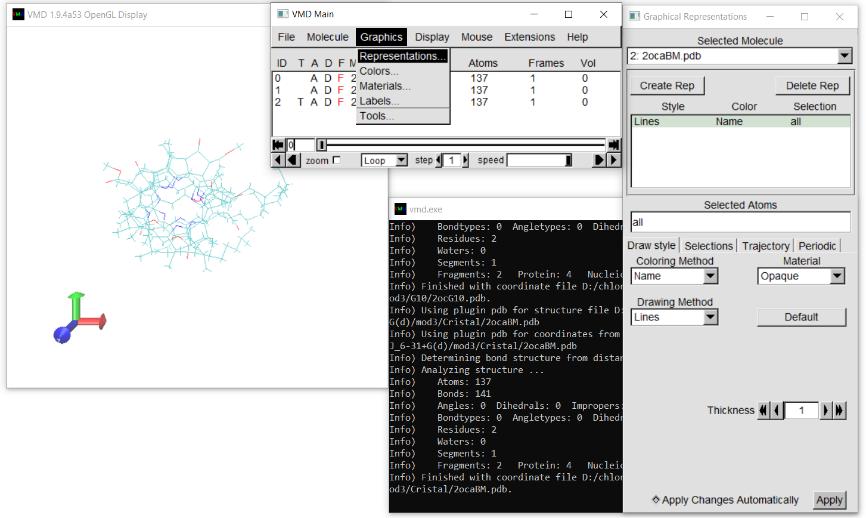
By default, the loaded molecules will still share the same color. To fix this, close Color Controls and open Representations under the Graphics menu.
At the top of Graphical Representation window, select your molecule one by one. For each molecule, change the Coloring Method to Molecule, the Drawing Method to CPK, and the Material to Glossy.***
Optionally, you can turn off the Axes and the Depth Cueing in Display main menu for a cleaner look.
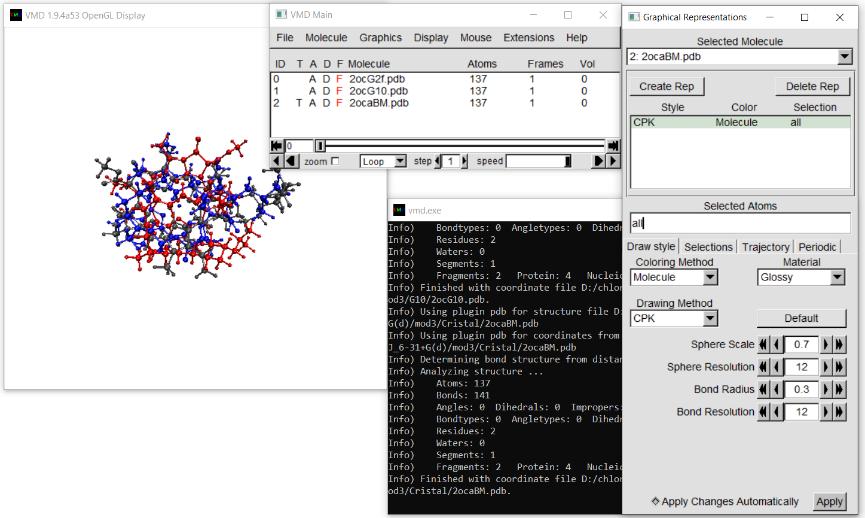
Now that each structure has a distinct “ball-and-stick” representation, we can proceed with the structural alignment:
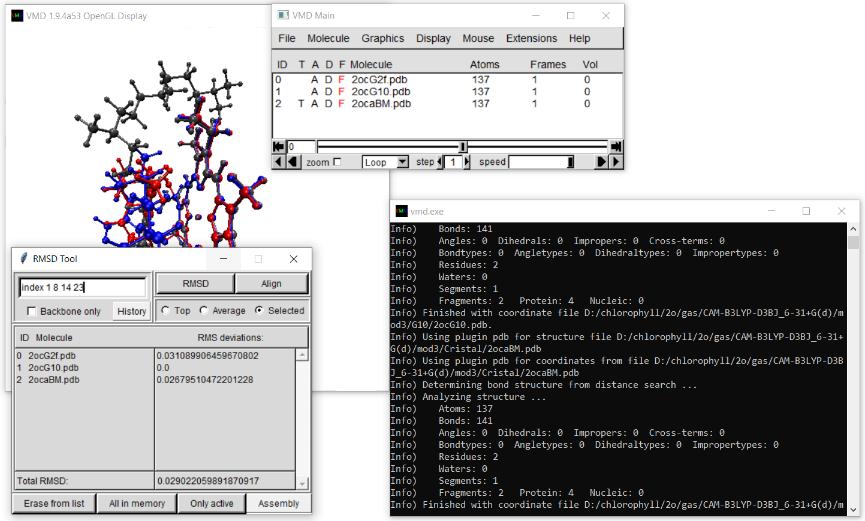
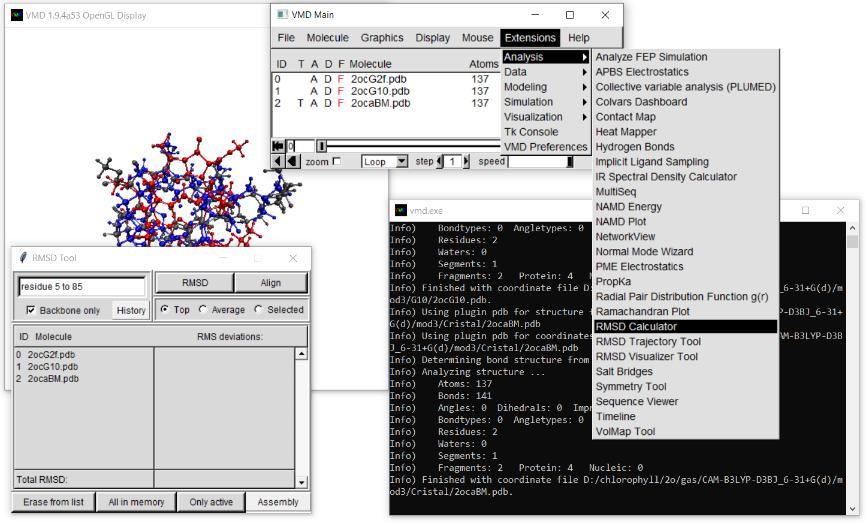
Close Graphical Representation window and navigate to Extensions → Analysis → RMSD Calculator.
In the RMSD Tool window, locate the next box that defaults to protein (or residue 5 to 85) and replace it with the specific index numbers of the atoms you want to use for the alignment. This should be conserved atoms that do not change position significantly between structures.
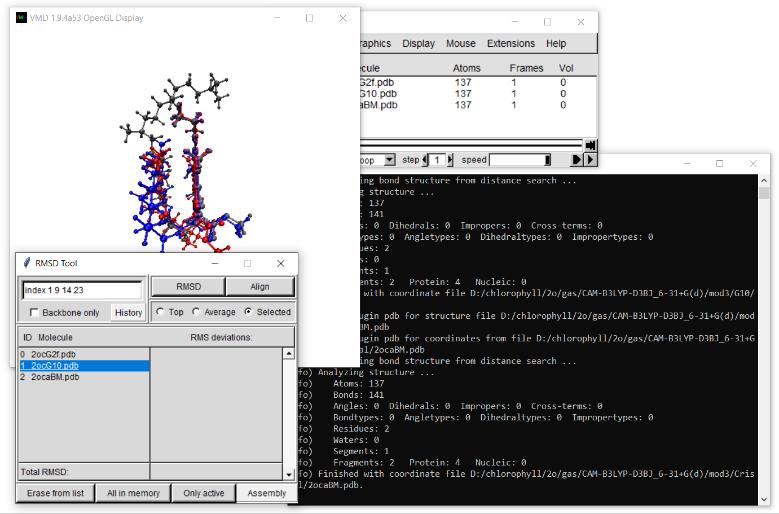
NOTE: VMD uses zero-based indexing. To select specific atoms, type index 0 1 2 3 or index 0 to 3.
Uncheck the Backbone only option. By default, the alignment uses the Top molecule as reference. You can change this by clicking the Selected radio button and choosing your reference molecule.
Click the Align button at the top right of the window.
Once the structures are aligned, calculating the Root-Mean-Square-Deviation (RMSD) is straightforward.
Click the RMSD button at the top of tool. The calculated value will appear in the list.
It is important to remember that VMD calculates the RMSD strictly based on the special distance deviation between the atoms of the reference structure (Aaref) and the comparison structure (Aacomp). VMD does not compare internal coordinates like bond lengths, angles or dihedrals.