
Nuclear Magnetic Resonance is a most powerful tool for elucidating the structure of diamagnetic compounds, which makes it practically universal for the study of organic chemistry, therefore the calculation of 1H and 13C chemical shifts, as well as coupling constants, is extremely helpful in the assignment of measured signals on a spectrum to an actual functional group.
Several packages offer an additive (group contribution) empirical approach to the calculation of chemical shifts (ChemDraw, Isis, ChemSketch, etc.) but they are usually only partially accurate for the simplest molecules and no insight is provided for the more interesting effects of long distance interactions (vide infra) so quantum mechanical calculations are really the way to go.
With Gaussian the calculation is fairly simple just use the NMR keyword in the route section in order to calculate the NMR shielding tensors for relevant nuclei. Bear in mind that an optimized structure with a large basis set is required in order to get the best results, also the use of an implicit solvation model goes a long way. The output displays the value of the total isotropic magnetic shielding for each nucleus in ppm (image taken from the Gaussian website):
Magnetic shielding (ppm):
  1  C    Isotropic =    57.7345   Anisotropy =   194.4092
   XX=    48.4143   YX=      .0000   ZX=      .0000
   XY=      .0000   YY=   -62.5514   ZY=      .0000
   XZ=      .0000   YZ=      .0000   ZZ=   187.3406
  2  H    Isotropic =    23.9397   Anisotropy =     5.2745
   XX=    27.3287   YX=      .0000   ZX=      .0000
   XY=      .0000   YY=    24.0670   ZY=      .0000
   XZ=      .0000   YZ=      .0000   ZZ=    20.4233
Now, here is why this is the long way; in order for these values to be meaningful they need to be contrasted with a reference, which experimentally for 1H and 13C is tetramethylsilane, TMS. This means you have to perform the same calculation for TMS at -preferably- the same level of theory used for the sample and substract the corresponding values for either H or C accordingly. Only then the chemical shifts will read as something we can all remember from basic analytical chemistry class.
GaussView 6.0 provides a shortcut; open the Results menu, select NMR and in the new window there is a dropdown menu for selecting the nucleus and a second menu for selecting a reference. In the case of hydrogen the available references are TMS calculated with the HF and B3LYP methods. The SCF – GIAO plot will show the assignments to each atom, the integration simulation and a reference curve if desired.
The chemical shifts obtained this far will be a good approximation and will allow you to assign any peaks in any given spectrum but still not be completely accurate though. The reasons behind the numerical deviations from calculated and experimental values are many, from the chosen method to solvent interactions or basis set limitations, scaling factors are needed; that’s when you can ask the Cheshire Cat which way to go
If you don’t know where you are going any road will get you there.
Lewis Carroll – Alice in Wonderland
Well, not really. The Chemical Shift Repository for computed NMR scaling factors, with Coupling Constants Added Too (aka CHESHIRE CCAT) provides with straight directions on how to correct your computed NMR chemical shifts according to the level of theory without the need to calculate the NMR shielding tensor for the reference compound (usually TMS as pointed out earlier). In a nutshell, the group of Prof. Dean Tantillo (UC Davis) has collected a large number of isotropic magnetic shielding values and plotted them against experimental chemical shifts. Just go to their scaling factors page and check all their linear regressions and use the values that more closely approach to your needs, there are also all kinds of scripts and spreadsheets to make your job even easier. Of course, if you make use of their website don’t forget to give the proper credit by including these references in your paper.
We’ve recently published an interesting study in which the 1H – 19F coupling constants were calculated via the long way (I was just recently made aware of CHESHIRE CCAT by Dr. Jacinto Sandoval who knows all kinds of web resources for computational chemistry calculations) as well as their conformational dependence for some substituted 2-aza-carbazoles (fig. 1).
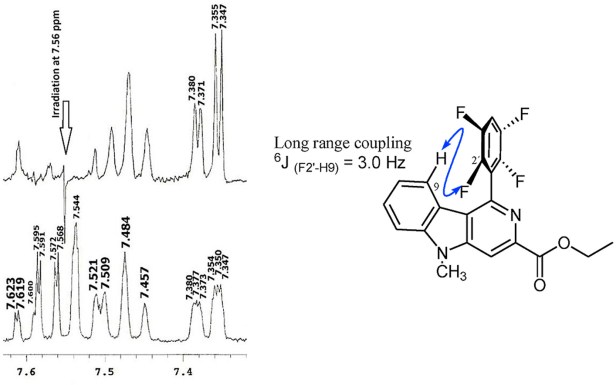
The paper is published in the Journal of Molecular Structure. In this study we used the GIAO NMR computations to assign the peaks on an otherwise cluttered spectrum in which the signals were overlapping due to conformational variations arising from the rotation of the C-C bond which re-orients the F atoms in the fluorophenyl grou from the H atom in the carbazole. After the calculations and the scans were made assigning the peaks became a straightforward task even without the use of scaling factors. We are now expanding these calculations to more complex systems and will contrast both methods in this space. Stay tuned.

Dear Prof. Barosso,
Thank you for posting explanations in a very simplistic way for the DFT calculations. They are always very useful. I am trying to perform an NMR calculation using JAGUAR. That’s when I searched your blog for that and I came across this post of yours which explains for Gaussian. Would you happen to know how to do the same but using JAGUAR? Thanks in advance.
Hello Hemlata,
Thanks for your kind words. I regret to inform you that I have zero experience in using JAGUAR. However, if you are able to calculate chemical displacements with it, then you could apply these same principles to scale the results to get closer to the experimental values.
I hope this helps
Dear Professor, If you want to calculate the nmr of 15N or 31P what is the references can I use? Can I use TMS as a reference to subtract the value?
@Neranjan – TMS has neither 15N or 31P nuclei. Assuming you have a university degree, I suggest you go back and re-read your textbooks. Or better, yet, give up that degree – humankind would be obliged.
Dear Prof Joaquin Barroso
i’m trying to simulate NMR spectra with Gaussian 16.
I’d like to Ask you if you ever have any problem to see spin multiplicity in NMR spectra from this software
Because for a simple molecule like Ethyl Acetate Gaussian doesn’t show me the multiplicity spin. (The ppm are rescaleted by TMS reference and they are correct respect to sperimental spectra).
I mean it doesn’t show me Doublet, triplet and so on…
how can i handle this?
I can share with you the jpeg file of ethyl acetate spectrum and gjf.
Thanks for your suggestion
Alessio Macorano