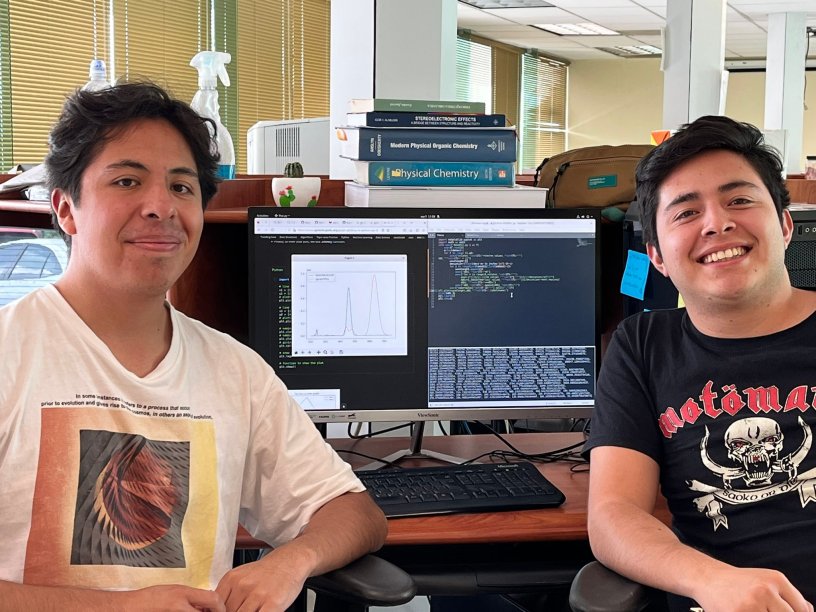
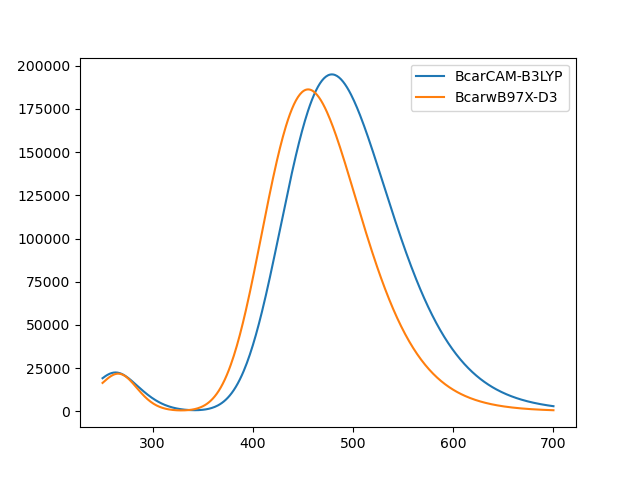
Undergraduate students in our lab shown in the picture above, Emanuel Contreras (right) and Humberto Estrada (left), just added a python-based code to our GitHub page, with which you can automatically plot UV-Vis spectra obtained from excited state calculations such as TD-DFT, CCSD, RAS, etc. made with QChem5.x (Gaussian16 availability coming soon!). You can choose the wavelength range and the band with, and use it to compare as many files simultaneously as you may want.
UVeh-Vis (eh from Emanuel and Humberto, of course) requires updated versions of Python 3 and Matplotlib. You start by cloning the source code from the terminal:
$ git clone https://github.com/joaquinbarroso/UVeh-Vis.git
After getting the source code, run ./setup edit the /home/username/.bashrc file with the final line from the previous output from setup. After editing, exit the terminal and now you can use it in a new terminal from the directory wherever your calculation files are located. It’s all in the README in the GitHub. The syntax is quite straightforward and you can always use UVeh-Vis -h for help with the options.
$UVeh-Vis -wl 250,700 [-dev 0.4] file1 [files ...]
The option -wl is required to establish the wavelength range in nm to be plotted; whereas -dev controls the standard deviation width (default value = 0.4).
Here’s the link to the Git Hub project, please use it and cite it as: Emanuel Contreras-Cuevas, Humberto Estrada-Lara, Joaquín Barroso-Flores, “UVeh-Vis: a python tool for plotting UV-Vis spectra from excited states calculations” (2023) Git Hub https://github.com/joaquinbarroso/UVeh-Vis.
