This new version of UVeh-Vis contains modifications of the graphical properties of the output plot:
- Font type, font size, legend style and widow size corrections.
- Now, the discontinuity of the plot at the start and the end of the plot is fixed, so the plot is now completely continuous
With some more technical features such as: - CSV file generations of your plot coordinates with the command “-csv”, file that will be saved in your path of execution as “output.csv”.
ex: “$ UVeh-Vis file1.out file2.out -wl 200,800 -csv” - Lorentzian adjustment is now available using the “-ltz” command.
ex: “$ UVeh-Vis file1.out file2.out -wl 200,800 -ltz” - Gaussian adjustment is still the default option and can be used with the “-gau” command.
ex: “$ UVeh-Vis file1.out file2.out -wl 200,800 -gau”
You can install this new version following the instructions from the previous post or update your current installed version by entering your PATH of installation and executing:
“$ git stash”
“$ git pull”
“$ ./setup”
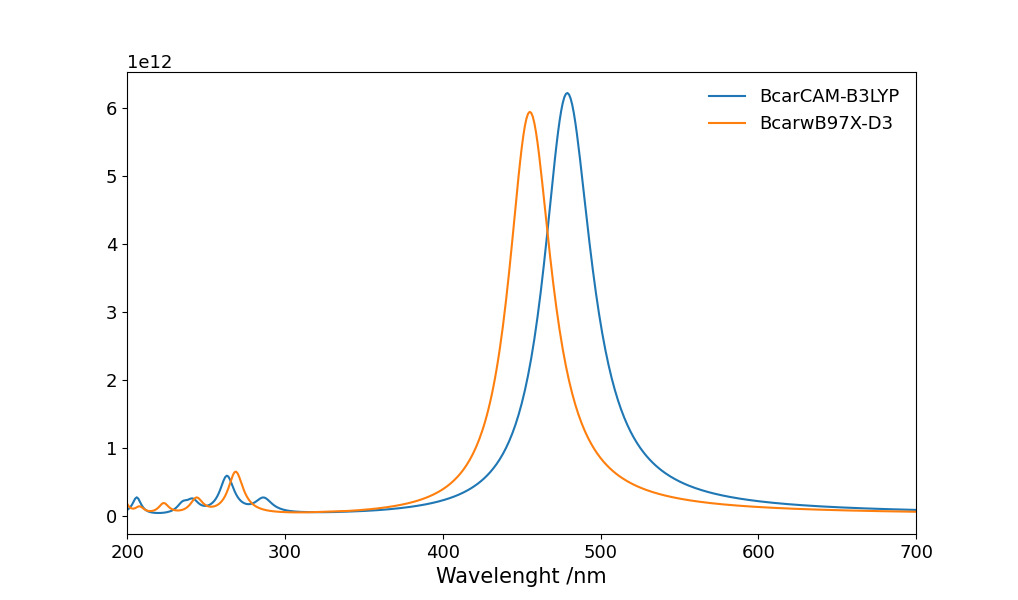
A UVeh-Vis comparison for a carotene molecule calculated at two different levels of theory using a lorentzian adjustment (Matplotlib)
Any issue can be uploaded to the repository issues (https://github.com/joaquinbarroso/UVeh-Vis/issues) and extra features coming soon.
If our code is useful for your research please cite it as: Emanuel Contreras-Cuevas, Humberto Estrada-Lara, Joaquín Barroso-Flores, “UVeh-Vis: a python tool for plotting UV-Vis spectra from excited states calculations” (2023) Git Hub https://github.com/joaquinbarroso/UVeh-Vis.